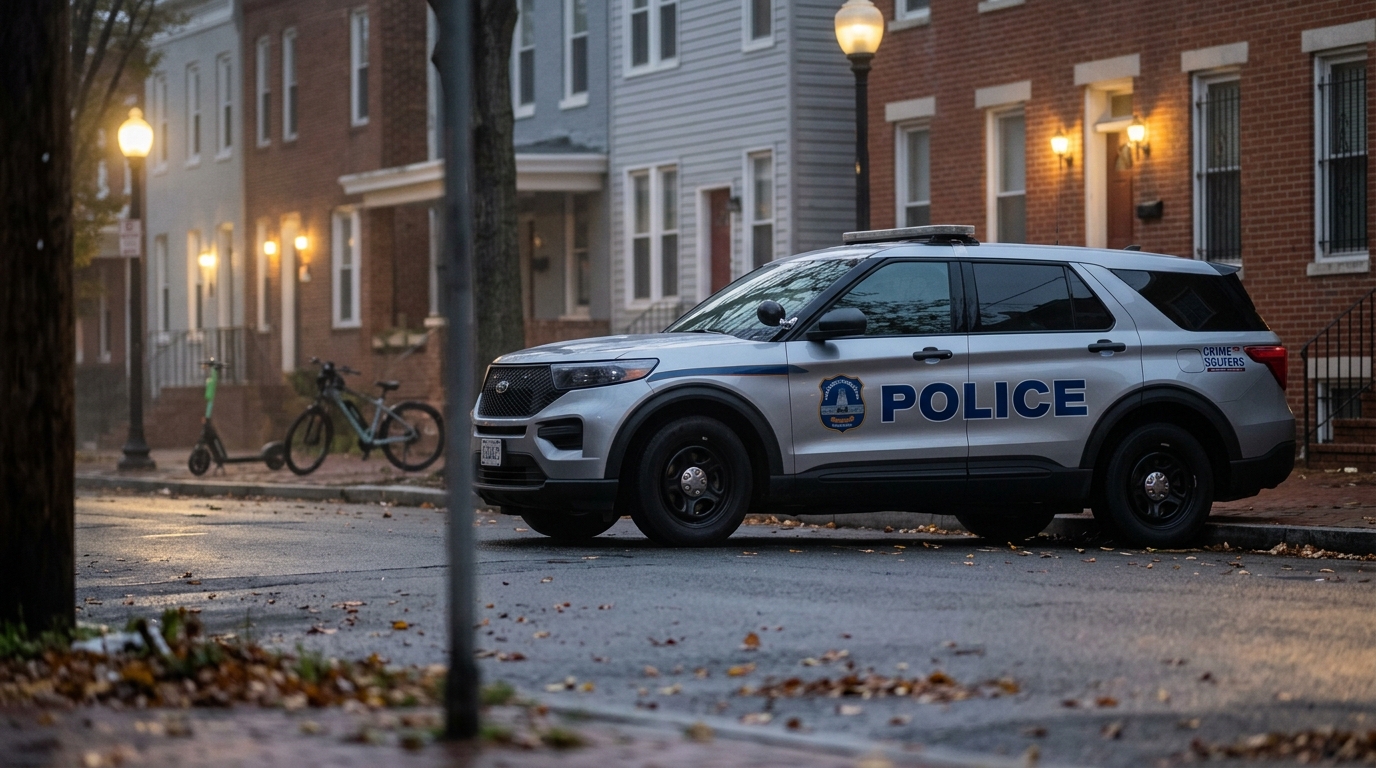
DMV Crime Statistics by County: A Plain-English Guide
Share this article

Navigating the complexities of crime data can be challenging, but understanding local trends is vital for residents and visitors alike. This comprehensive guide from DMV News breaks down DMV crime statistics by county, offering a plain-English look at official reports from Washington D.C., Maryland, and Virginia. We aim to demystify the numbers, providing clear, actionable insights into safety and crime patterns across our diverse region.
Quick Answer: Understanding DMV crime statistics by county involves reviewing official data from state and local law enforcement agencies in Maryland, Virginia, and Washington D.C. While trends vary significantly by jurisdiction and crime type, common metrics include violent and property crime rates. Official sources like the Maryland State Police, Virginia State Police, and D.C. Metropolitan Police Department provide the most reliable information for assessing local safety and crime patterns.
Understanding the Data: What Are DMV Crime Statistics?
When we discuss DMV crime statistics by county, we are referring to the systematic collection and analysis of reported criminal incidents within the distinct jurisdictions of Washington D.C., Maryland, and Virginia. These statistics are primarily compiled through the Uniform Crime Reporting (UCR) Program, a nationwide effort managed by the Federal Bureau of Investigation (FBI) that standardizes how law enforcement agencies categorize and report crimes. In our region, this data is then often filtered and published by state-level agencies, such as the Maryland State Police and the Virginia State Police, or directly by local police departments and sheriff's offices.
The UCR program typically focuses on "Part I" offenses, which are serious crimes categorized into two groups: violent crimes and property crimes. Violent crimes include murder, rape, robbery, and aggravated assault. Property crimes encompass burglary, larceny-theft (including motor vehicle theft), and arson. It's crucial to understand that these statistics reflect reported crimes, not necessarily all crimes committed, and various factors can influence reporting rates. For instance, a community with improved reporting mechanisms might show an increase in reported crime even if the actual incidence hasn't significantly changed. Therefore, a careful, attribution-first approach is essential when interpreting these figures, always referring back to the source data and any contextual notes provided by the collecting agency.
The Scope of Reporting
Each county and independent city across Maryland and Virginia, along with the District of Columbia, contributes its data to these larger statistical pools. This allows for a granular view of crime trends, enabling residents, policymakers, and community leaders to assess local safety concerns and allocate resources effectively. Understanding the methodology behind these statistics – what is counted, how it's classified, and the limitations of the data – is the first step toward a truly informed perspective on crime in the DMV.
Maryland County Crime Overview: Key Trends and Figures
Maryland's diverse geography, from the bustling urban centers of Prince George's and Montgomery Counties to the more rural Eastern Shore, is reflected in its varied crime statistics. The Maryland State Police (MSP) plays a central role in compiling and disseminating UCR data for the state, providing an essential resource for understanding DMV crime statistics by county within Maryland. Their annual reports detail violent crime rates (murder, rape, robbery, aggravated assault) and property crime rates (burglary, larceny-theft, motor vehicle theft) for each of Maryland's 23 counties and Baltimore City, which functions as an independent jurisdiction.
Historically, areas with higher population density, such as Prince George's County and Baltimore City, tend to report higher absolute numbers of certain crimes. However, crime rates, calculated per 100,000 residents, offer a more accurate comparison across counties of differing sizes. For example, while Baltimore City often registers a high number of violent crimes, counties like Howard or Carroll consistently report some of the lowest violent and property crime rates in the state. Conversely, while overall property crime might see fluctuations, specific categories like motor vehicle theft have sometimes shown notable spikes in suburban counties bordering D.C., such as Montgomery and Anne Arundel, reflecting broader regional trends.
Notable County Trends
- Montgomery County: Generally maintains lower violent crime rates compared to some other major jurisdictions but faces ongoing challenges with property crimes, particularly vehicle-related offenses in commercial corridors.
- Prince George's County: Often grapples with higher violent crime rates, especially in certain neighborhoods, though sustained efforts by local law enforcement have aimed to address these specific challenges.
- Anne Arundel County: Presents a mixed picture, with some areas experiencing relatively low crime and others, particularly along major transportation routes or near urban hubs like Annapolis, seeing higher instances of property crime.
- Frederick County: Typically reports lower crime rates overall, benefiting from a blend of suburban and rural characteristics, though growth brings its own set of public safety considerations.
It's important to remember that these are broad observations. Residents should always consult the latest reports from the Maryland State Police or their specific county's sheriff's office for the most current and localized data, paying attention to year-over-year comparisons to identify sustained trends rather than short-term anomalies.
Virginia County Crime Overview: Key Trends and Figures
Virginia's landscape of 95 counties and 38 independent cities presents a complex picture of crime statistics, meticulously tracked by the Virginia State Police (VSP) through their Uniform Crime Reporting (UCR) program. When examining DMV crime statistics by county in Virginia, it's essential to differentiate between these independent cities, which are treated as separate reporting jurisdictions, and the surrounding counties. The VSP's annual Crime in Virginia report provides a detailed breakdown of violent and property crimes, allowing for granular analysis across the Commonwealth.
The northern Virginia region, often referred to as "NoVA," includes some of the state's most populous and economically robust counties, such as Fairfax, Loudoun, and Prince William. These counties often report some of the lowest violent crime rates per capita in the entire DMV region, contributing to Virginia's overall reputation for safety. However, due to their high population density and economic activity, property crimes like larceny-theft and motor vehicle theft can still be significant in absolute numbers. For instance, Fairfax County, while very safe by violent crime metrics, will naturally have more reported property crimes than a less populated rural county simply due to the volume of potential targets.
Key Virginia Jurisdictions
- Fairfax County: Consistently recognized for its low violent crime rates, often ranking among the safest large jurisdictions in the nation. Property crimes, while present, are generally well below national averages when adjusted for population.
- Loudoun County: Frequently cited for its exceptionally low crime rates across both violent and property categories, reflective of its rapid growth and affluent demographics.
- Prince William County: Balances significant population growth with generally moderate crime rates, though specific urbanized areas within the county may experience localized crime challenges.
- Arlington County: Being geographically small and densely populated, Arlington typically reports low violent crime rates, while property crime figures are influenced by its urban character and proximity to D.C.
- Alexandria (Independent City): Similar to Arlington, this independent city maintains relatively low violent crime rates, with property crime patterns mirroring those of a dense urban environment.
Beyond NoVA, other regions of Virginia also contribute to the statewide picture. For instance, cities like Richmond and Norfolk, while not counties, play a significant role in statewide crime discussions due to their higher urban crime rates, particularly in violent crime categories. These independent cities highlight the importance of consulting specific jurisdictional data when assessing safety in Virginia. The Virginia State Police website remains the definitive source for the most up-to-date and detailed crime statistics, allowing residents to examine trends for their specific county or independent city over multiple years.
Washington D.C. Crime Landscape: A Jurisdictional View
Washington D.C., as a single federal district rather than a collection of counties, presents a unique perspective within DMV crime statistics by county discussions. While it doesn't have counties, its eight wards serve as a common way to analyze crime patterns within the city. The Metropolitan Police Department (MPD) is the primary law enforcement agency responsible for compiling and reporting crime data for the District, making their annual reports and online crime dashboards indispensable resources.
D.C.'s crime landscape is often characterized by higher rates of both violent and property crimes compared to many of its suburban Maryland and Virginia counterparts. However, these rates can vary significantly across the city's different wards and neighborhoods. For instance, Wards 2 and 3, which include areas like Georgetown, Foggy Bottom, and parts of Northwest, typically report lower violent crime rates but can see higher instances of property crimes such as larceny-theft, often related to commercial activity and tourism. Conversely, Wards 7 and 8, located east of the Anacostia River, have historically faced greater challenges with violent crime, including homicides and aggravated assaults.
Ward-Specific Trends and Challenges
- Ward 2 & 3 (Northwest D.C.): Generally lower violent crime rates, but property crimes (thefts, vehicle break-ins) can be notable due to high commercial activity and tourist presence.
- Ward 1 & 6 (Central D.C.): These wards, encompassing areas like Columbia Heights, Shaw, and Capitol Hill, experience a mix of urban crime challenges, with fluctuating rates of both violent and property offenses influenced by population density and nightlife.
- Ward 4 & 5 (Northeast/Northwest D.C.): These areas, including neighborhoods like Petworth and Brookland, often fall in the middle range for crime rates, experiencing localized issues that require targeted community and policing efforts.
- Ward 7 & 8 (East of the Anacostia River): Historically face the most significant challenges with violent crime, including a disproportionate share of homicides and shootings. These areas are often the focus of intensive community intervention and law enforcement strategies.
It's important to note that crime trends in D.C. can be dynamic, influenced by socioeconomic factors, policing strategies, and community engagement. The MPD's online crime map and data portals allow residents to track specific crime types down to the block level, providing a transparent and timely resource for understanding local safety conditions. Analyzing D.C.'s data alongside that of Maryland and Virginia offers a complete picture of regional crime, highlighting both shared challenges and unique jurisdictional characteristics.
Factors Influencing Crime Rates Across the DMV
Understanding DMV crime statistics by county goes beyond simply reporting numbers; it requires an examination of the multifaceted factors that influence these rates. Crime is a complex social phenomenon, and its prevalence in any given area is often shaped by a confluence of socio-economic conditions, demographic shifts, law enforcement strategies, and community resources. In the diverse DMV region, these factors interact in unique ways, leading to the varied crime landscapes we observe.
One primary factor is **socio-economic status**. Areas with higher rates of poverty, unemployment, and lack of educational opportunities often correlate with elevated crime rates, particularly violent crimes. This is not to say poverty causes crime, but rather that systemic disadvantages can create environments where crime is more likely to occur. Conversely, more affluent areas typically report lower violent crime rates, though they may still be susceptible to property crimes like theft and burglary, often targeting valuable assets.
Key Influential Factors
- Population Density and Urbanization: Densely populated urban areas, like Washington D.C. or inner-ring suburbs of Maryland and Virginia, tend to have higher crime rates per capita than rural areas. Increased opportunities for interaction, anonymity, and access to potential targets contribute to this trend.
- Economic Opportunity and Inequality: Disparities in income, access to jobs, and educational resources can create conditions that foster crime. Communities with robust local economies and low unemployment often experience lower crime rates.
- Law Enforcement Presence and Strategy: The size, resources, and operational strategies of local police departments and sheriff's offices play a significant role. Targeted policing efforts, community engagement programs, and effective resource allocation can influence crime trends.
- Community Resources and Support Systems: Strong community organizations, youth programs, mental health services, and housing support can act as protective factors, helping to reduce crime by addressing underlying social issues.
- Proximity to Major Transportation Hubs and Borders: Areas near major highways (e.g., I-95, I-270, I-66) or jurisdictional borders can sometimes see higher rates of certain crimes, as these routes facilitate movement for offenders and can create challenges for inter-agency coordination.
- Drug Activity: The prevalence of drug use and distribution often correlates with other types of crime, including violent offenses and property crimes committed to fund drug habits.
Demographic shifts, such as changes in age distribution or migration patterns, can also subtly influence crime trends over time. When analyzing crime statistics, it's vital to consider these broader societal and environmental contexts. Attributing changes solely to one factor is often an oversimplification; instead, a holistic view that acknowledges the interplay of multiple elements provides a more accurate understanding of crime in the DMV region.
How to Access Official Crime Data for Your Community
For residents, researchers, and policymakers seeking the most accurate and up-to-date DMV crime statistics by county, accessing official sources is paramount. Relying on anecdotal evidence or unverified reports can be misleading. Fortunately, the primary law enforcement agencies in Maryland, Virginia, and Washington D.C. provide robust platforms for public access to their crime data. These resources offer transparency and empower communities with the information needed to understand local safety conditions.
Maryland Official Data Sources
The Maryland State Police (MSP) is the central repository for Uniform Crime Reporting (UCR) data in the state. Their official website typically hosts annual UCR reports, which provide county-by-county breakdowns of violent and property crimes. You can usually find these reports under sections like "Crime Statistics" or "Publications." Many individual county sheriff's offices and municipal police departments also publish their own annual reports or maintain online crime maps/dashboards that offer more localized, real-time data.
- Maryland State Police: Visit the official MSP website and look for the "Crime in Maryland" or "UCR Data" section.
- Local County Police/Sheriff's Websites: For example, the Montgomery County Police Department, Prince George's County Police Department, or Anne Arundel County Police Department often have dedicated statistics pages or crime maps.
Virginia Official Data Sources
The Virginia State Police (VSP) compiles and publishes comprehensive crime data for the Commonwealth, including statistics for its 95 counties and 38 independent cities. Their "Crime in Virginia" annual report is the authoritative source, offering detailed tables and analyses. Similar to Maryland, many larger county police departments and city police departments in Virginia provide their own local data portals or annual summaries.
- Virginia State Police: Navigate to the VSP website and search for "Crime in Virginia" or "UCR Data."
- Local County/City Police Websites: Examples include the Fairfax County Police Department, Loudoun County Sheriff's Office, or Arlington County Police Department, which often feature crime data on their public safety sections.
Washington D.C. Official Data Sources
For Washington D.C., the Metropolitan Police Department (MPD) is the go-to source for crime statistics. The MPD maintains an extensive online crime map and data portal that allows users to search for specific crime types by date, location, and ward. This interactive tool is one of the most user-friendly resources in the region for real-time crime information.
- Metropolitan Police Department (MPD): Access the MPD's official website and look for their "Crime Data" or "Crime Map" sections.
When accessing data, always note the reporting period (e.g., calendar year, fiscal year) and any disclaimers about data collection methodology. Comparing data year-over-year from the same source provides the most consistent and reliable insight into crime trends in your community.
Beyond the Numbers: Context and Community Impact
While DMV crime statistics by county provide a critical quantitative measure of public safety, they tell only part of the story. To truly understand the impact of crime and the dynamics of community safety, it is essential to look beyond raw numbers and consider the broader context, human experience, and qualitative aspects of crime. Statistics, by their nature, are aggregate figures; they don't capture the individual trauma of victims, the fear felt by residents, or the resilience of communities working to address underlying issues.
For instance, a slight increase in a specific crime category in a county might trigger concern, but understanding the context is vital. Was it a series of related incidents by a single perpetrator? Was there a change in reporting practices? Or does it reflect a deeper, systemic issue? Community leaders, law enforcement officials, and residents often engage in discussions that add this crucial qualitative layer to statistical data. Town halls, neighborhood watch meetings, and local news reports often highlight the human dimension of crime, offering narratives that complement the cold figures.
The Human Element and Prevention
Treating victims with respect means acknowledging their experiences are not reducible to a data point. The long-term effects of crime on individuals and communities, including psychological impacts, economic strain, and eroded trust, are profound and cannot be fully quantified. Therefore, prevention strategies and community-led initiatives are not just about reducing numbers but about fostering environments where residents feel safe, supported, and empowered.
Across the DMV, numerous organizations and programs are dedicated to crime prevention, victim support, and community building. These efforts range from youth mentorship programs in Washington D.C. wards, to neighborhood watch groups in suburban Maryland, to specialized law enforcement units focusing on gang violence in Virginia. Understanding crime statistics should serve as a starting point for informed dialogue and collaborative action, rather than an end in itself. It’s about leveraging data to identify challenges, celebrate successes, and continuously strive for safer, more resilient communities throughout our region.
Frequently Asked Questions
What are the safest counties in the DMV region based on crime statistics?
Determining the 'safest' county requires careful analysis of various crime metrics, including violent and property crime rates. While official data often highlights areas with lower reported incidents, perceived safety can also factor into residents' experiences. It's crucial to consult specific county-level reports for a comprehensive understanding.
How can I access official crime statistics for my specific county in Maryland or Virginia?
Official crime statistics for Maryland counties are typically available through the Maryland State Police's annual Uniform Crime Reporting (UCR) program. For Virginia, the Virginia State Police maintains similar UCR data, often broken down by county and independent city. Additionally, many local county police departments publish their own annual reports or maintain online data portals.
Are crime rates generally increasing or decreasing across the DMV counties?
Crime rate trends in the DMV vary significantly by county and crime type. While some areas might experience an in certain categories, others may see decreases, aligning with national patterns. A comprehensive view requires examining multi-year data from official sources to identify sustained trends rather than short-term fluctuations.
What types of crimes are typically included in county-level statistics?
County-level crime statistics typically encompass both violent crimes and property crimes. Violent crimes often include murder, rape, robbery, and aggravated assault, while property crimes cover burglary, larceny-theft, and motor vehicle theft. These categories are standardized under the Uniform Crime Reporting (UCR) program for consistent data collection.
Do 'DMV crime statistics' also cover Washington D.C. or only Maryland and Virginia counties?
When discussing 'DMV crime statistics,' Washington D.C. is generally included alongside Maryland and Virginia. While D.C. functions as a single jurisdiction rather than having counties, its crime data is crucial for a complete regional picture. Official statistics for D.C. are typically provided by the Metropolitan Police Department and contribute to the broader regional analysis.
Explore more on this topic
Related Stories
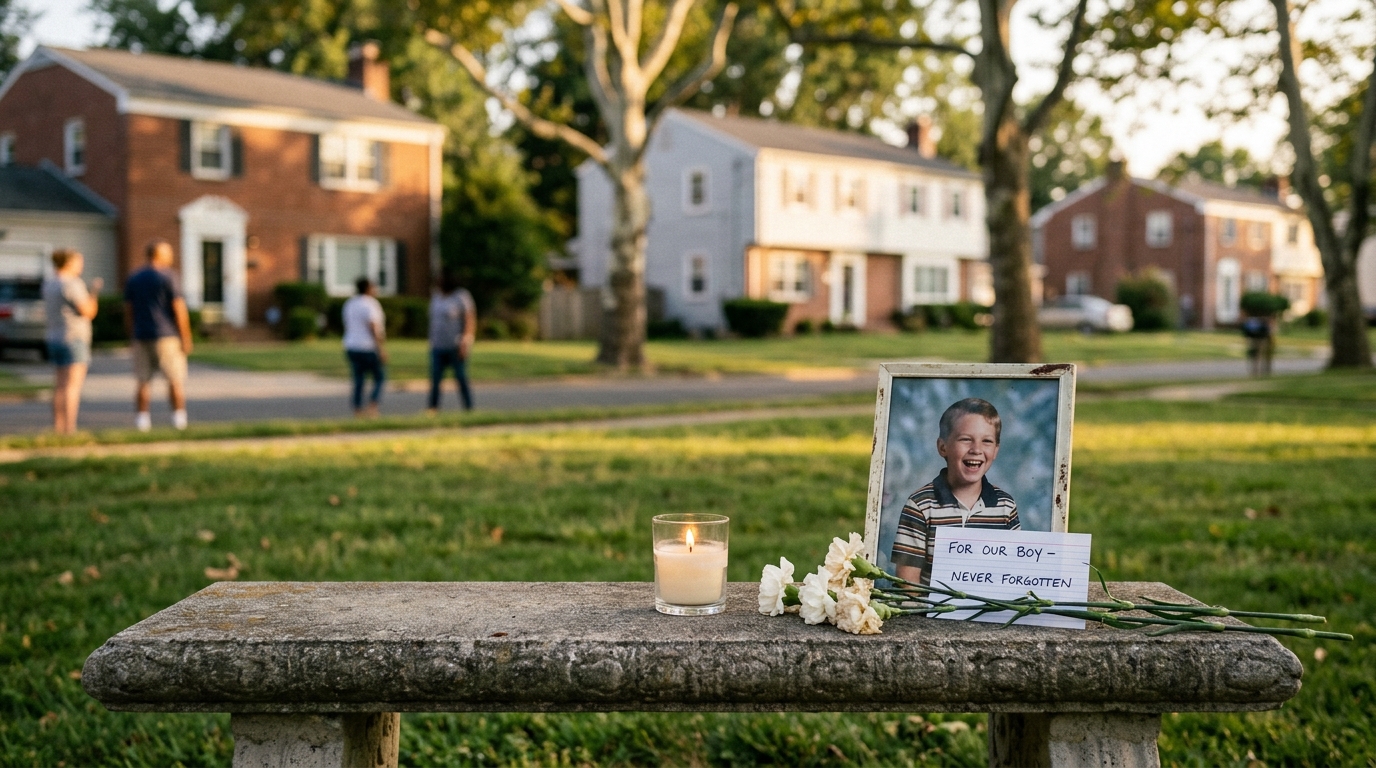
Indictment in 1993 Maryland Cold Case Brings Hope After Three Decades
After more than three decades, an indictment has finally been handed down in the 1993 murder of a 10-year-old boy in Maryland, offering a crucial step toward justice in a long-standing cold case.
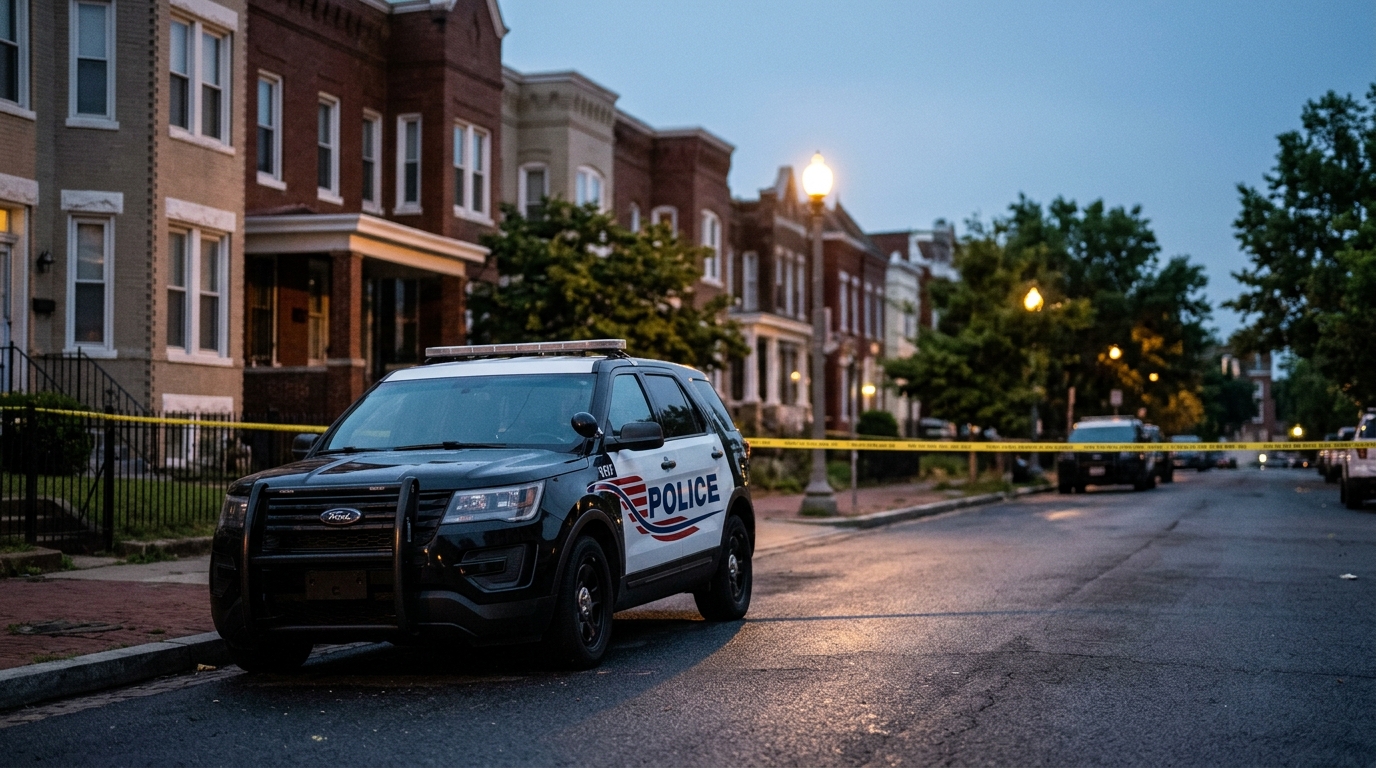
Deadly Shooting Reported at Alleged Squatter's Home in Washington, D.C.
A deadly shooting has been reported at an alleged squatter's home in Washington, D.C., sparking concerns about public safety and property disputes in the community. Authorities are investigating the incident, with details remaining scarce as residents grapple with the implications of such a tragic event.